11.68 Text Path Smooth Plot
20220109
set.seed(142)
cities <- c("Canberra", "Darwin", "Sydney")
cols <- c("forestgreen", "deepskyblue4", "tomato4")
ds %>%
filter(location %in% cities) %>%
sample_n(1000) %>%
ggplot(aes(x=temp_3pm, y=humidity_3pm)) +
geom_point(alpha=0.05) +
geom_textsmooth(aes(label=location, colour=location),
method="loess",
formula=y~x,
size=5,
linetype=3,
fontface=2,
linewidth=1) +
scale_colour_manual(values = cols) +
labs(x="Temperature 3pm", y="Humidity 3pm") +
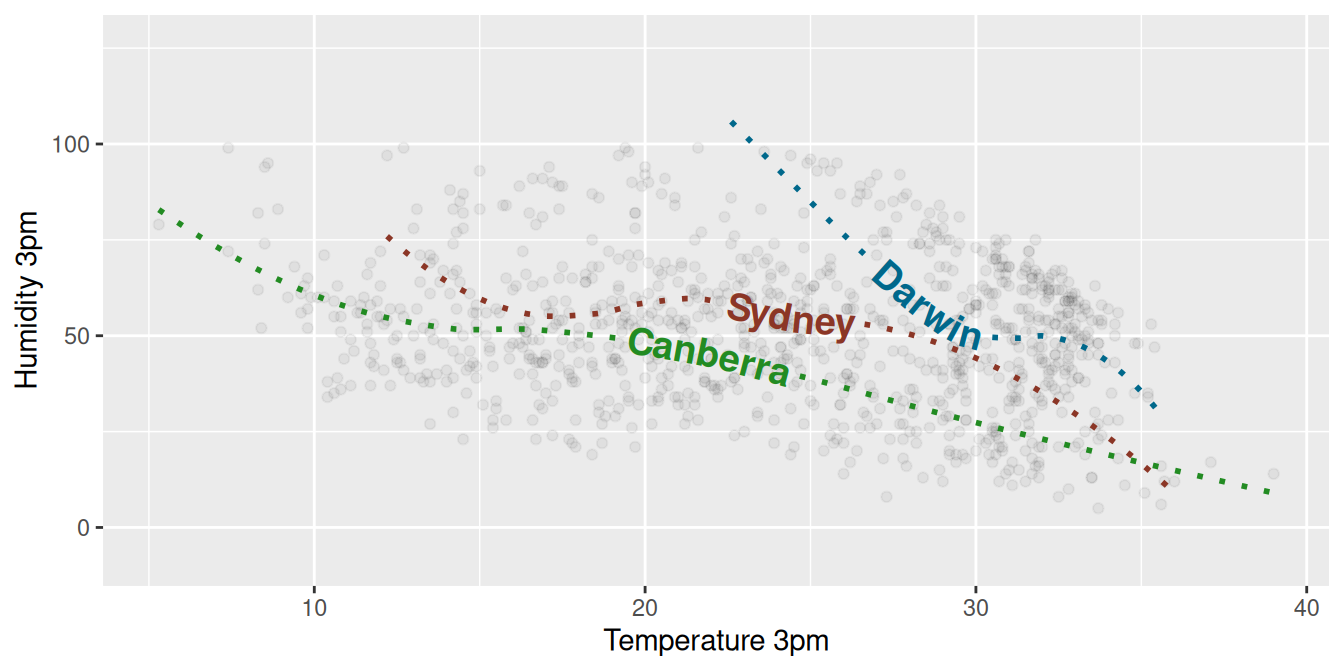
theme(legend.position="none")Using geomtextpath (Cameron and van den Brand 2024) we can utilise
geomtextpath::geom_textsmooth() on top of ggplot2::geom_point().
The points are faintly displayed using a small alpha=.
Notice the use of base::set.seed() so that each time this document is processed the randomly selected data is the same, so we generate the same plot each time.
References
Cameron, Allan, and Teun van den Brand. 2024. Geomtextpath: Curved Text in Ggplot2. https://allancameron.github.io/geomtextpath/.
Your donation will support ongoing availability and give you access to the PDF version of this book. Desktop Survival Guides include Data Science, GNU/Linux, and MLHub. Books available on Amazon include Data Mining with Rattle and Essentials of Data Science. Popular open source software includes rattle, wajig, and mlhub. Hosted by Togaware, a pioneer of free and open source software since 1984. Copyright © 1995-2022 Graham.Williams@togaware.com Creative Commons Attribution-ShareAlike 4.0
