20.9 Rattle View Decision Tree
Click the Draw button to display the decision tree. A visual representation is often simpler to understand.
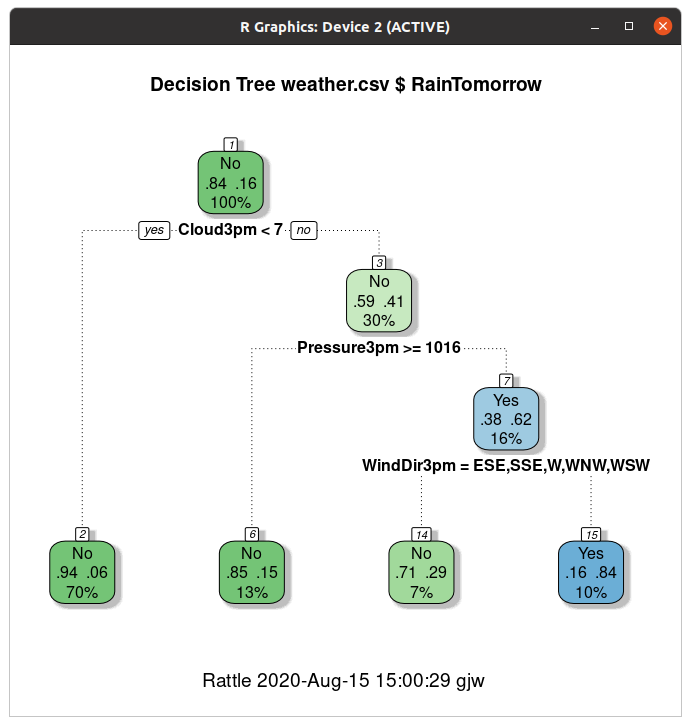
For a classification tree as we have here colour is used to
differentiate the predicted (majority) class for each node. For our
example the class/decision No is green and Yes is
blue. The intensity of the colour indicates the strength of the
prediction which is proportional to the percentage of the majority
class within that node.
The root node (node number 1) has 84% No and 16%
Yes and so is reported as a No decision or
class. That is, in the absence of any other information, we predict
that it will not rain tomorrow, and expect that prediction to be 84%
correct.
Your donation will support ongoing availability and give you access to the PDF version of this book. Desktop Survival Guides include Data Science, GNU/Linux, and MLHub. Books available on Amazon include Data Mining with Rattle and Essentials of Data Science. Popular open source software includes rattle, wajig, and mlhub. Hosted by Togaware, a pioneer of free and open source software since 1984. Copyright © 1995-2022 Graham.Williams@togaware.com Creative Commons Attribution-ShareAlike 4.0
