20.59 Enhanced Plots: Draw Branches as Dotted Lines
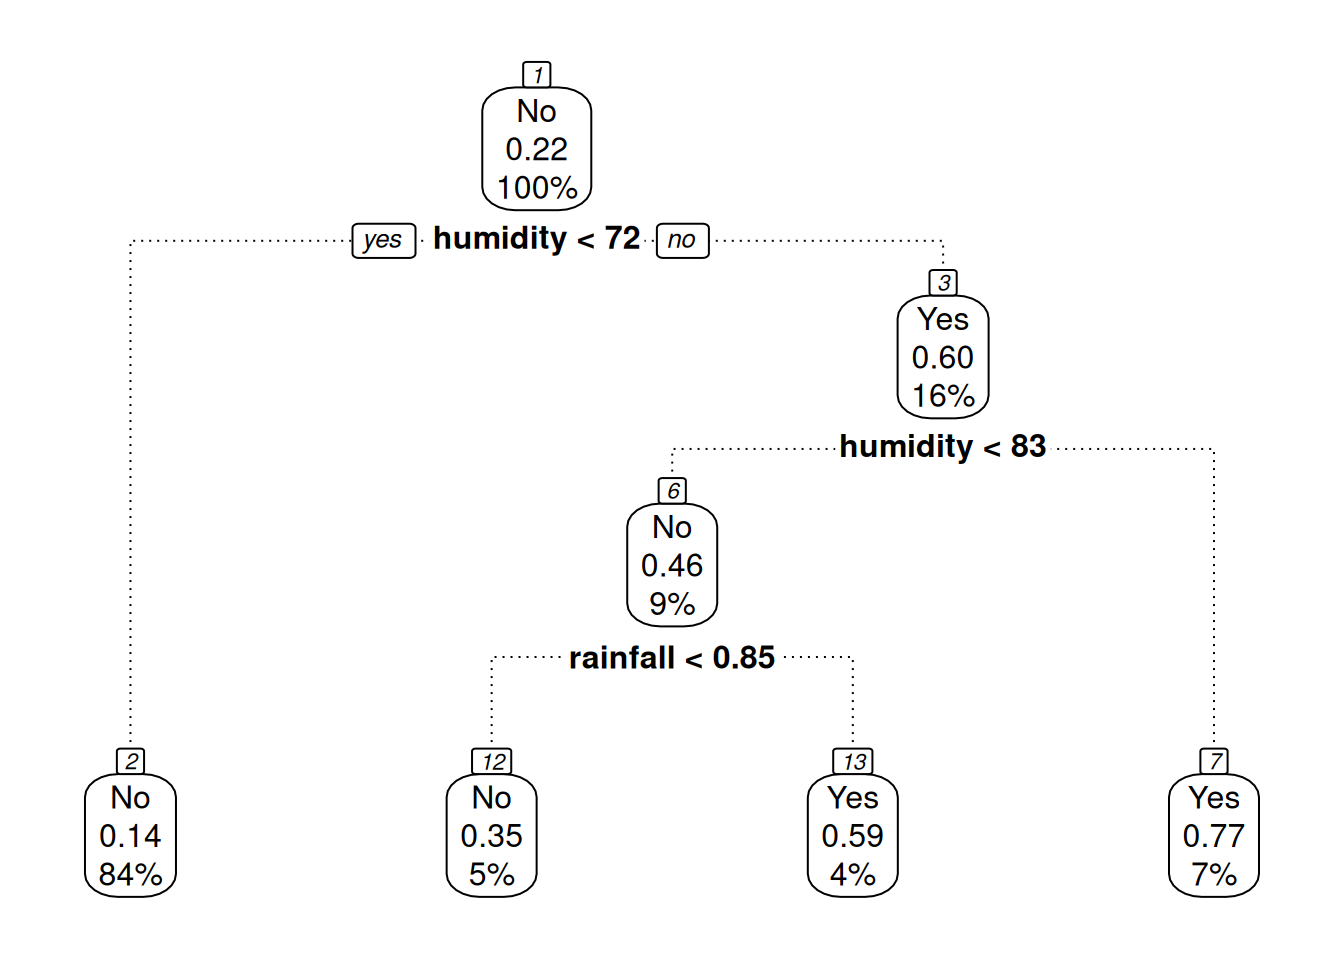
The branch.lty= option allows us to specify the type of line to draw for the branches. A dotted line is attractive as it reduces the dominance of the branches whilst retaining the node connections. Other options are just the standard values for line type in R:
% Following came from % http://students.washington.edu/mclarkso/documents/line%20styles%20Ver2.pdf Give credit in Further Reading section of Plots.Rnw
The line type can also be specified as an even length string of up eight characters of the hex digits (0–9, a–f). The pairs specify the length in pixels of the line and the blank. Thus lty=“44” is the same as lty=2:
Your donation will support ongoing availability and give you access to the PDF version of this book. Desktop Survival Guides include Data Science, GNU/Linux, and MLHub. Books available on Amazon include Data Mining with Rattle and Essentials of Data Science. Popular open source software includes rattle, wajig, and mlhub. Hosted by Togaware, a pioneer of free and open source software since 1984. Copyright © 1995-2022 Graham.Williams@togaware.com Creative Commons Attribution-ShareAlike 4.0
