11.35 Faceted Wind Direction
20200608
lblr <- function(x)
{
x %>%
str_replace_all("n", "North ") %>%
str_replace_all("s", "South ") %>%
str_replace_all("e", "East ") %>%
str_replace_all("w", "West ") %>%
str_replace(" $", "")
}
ds %>%
sample_n(10000) %>%
ggplot(aes(x=min_temp, y=max_temp, colour=rain_tomorrow)) +
geom_point(shape=".") +
geom_smooth(method="gam", formula=y~s(x, bs="cs")) +
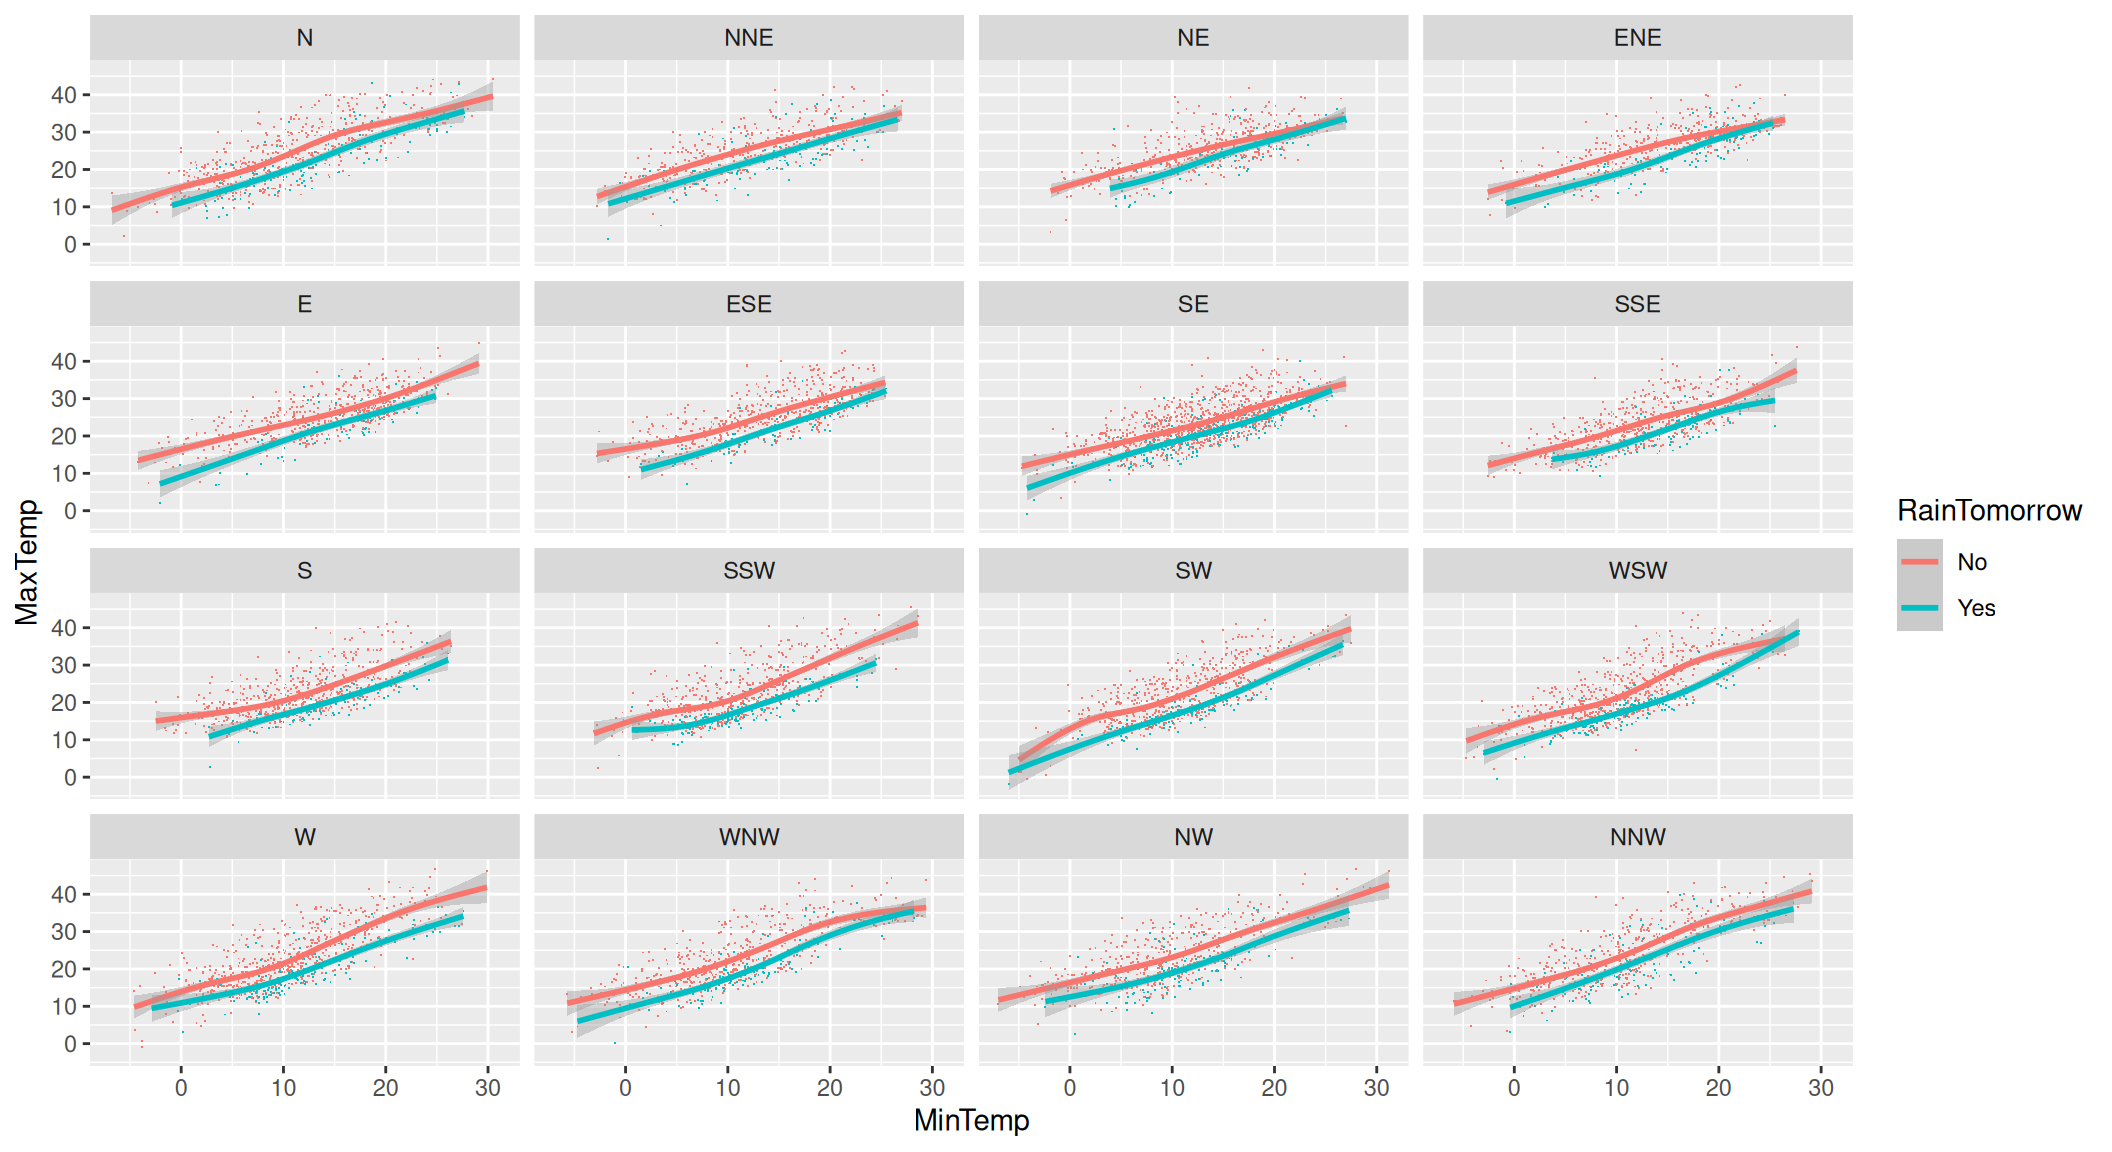
facet_wrap(~wind_dir_3pm, labeller=labeller(wind_dir_3pm=lblr)) +
labs(x = vnames["min_temp"],
y = vnames["max_temp"],
colour = vnames["rain_tomorrow"])Labels of a faceted plot can be modified as here expanding n to North, s to South, etc. Observe that the linear relationship for rainy days is below that for dry days. The maximum temperature is generally closer to the minimum temperature on days where it rains the following day.
The function to remap the directions uses stringr::str_replace_all() to do the work. It is then transformed into a ggplot2::labeller() for wind_dir_3pm=.
Your donation will support ongoing availability and give you access to the PDF version of this book. Desktop Survival Guides include Data Science, GNU/Linux, and MLHub. Books available on Amazon include Data Mining with Rattle and Essentials of Data Science. Popular open source software includes rattle, wajig, and mlhub. Hosted by Togaware, a pioneer of free and open source software since 1984. Copyright © 1995-2022 Graham.Williams@togaware.com Creative Commons Attribution-ShareAlike 4.0
