14.12 Risk Chart
A risk chart is also known as an accumulative performance
plot. Figure @ref(fig:memplate:rp_evaluate_test_riskchart) shows a
rattle::riskchart() based on the te dataset.
riskchart(pr_te, actual_te, risk_te) +
  labs(title="Risk Chart - Test Dataset") +
  theme(plot.title=element_text(size=14))
## Warning in ggplot2::guide_legend(keywidth = 3, labels = 1:3, title = "Legend"): Arguments in `...` must be used.
## ✖ Problematic argument:
## • labels = 1:3
## ℹ Did you misspell an argument name?
## Arguments in `...` must be used.
## ✖ Problematic argument:
## • labels = 1:3
## ℹ Did you misspell an argument name?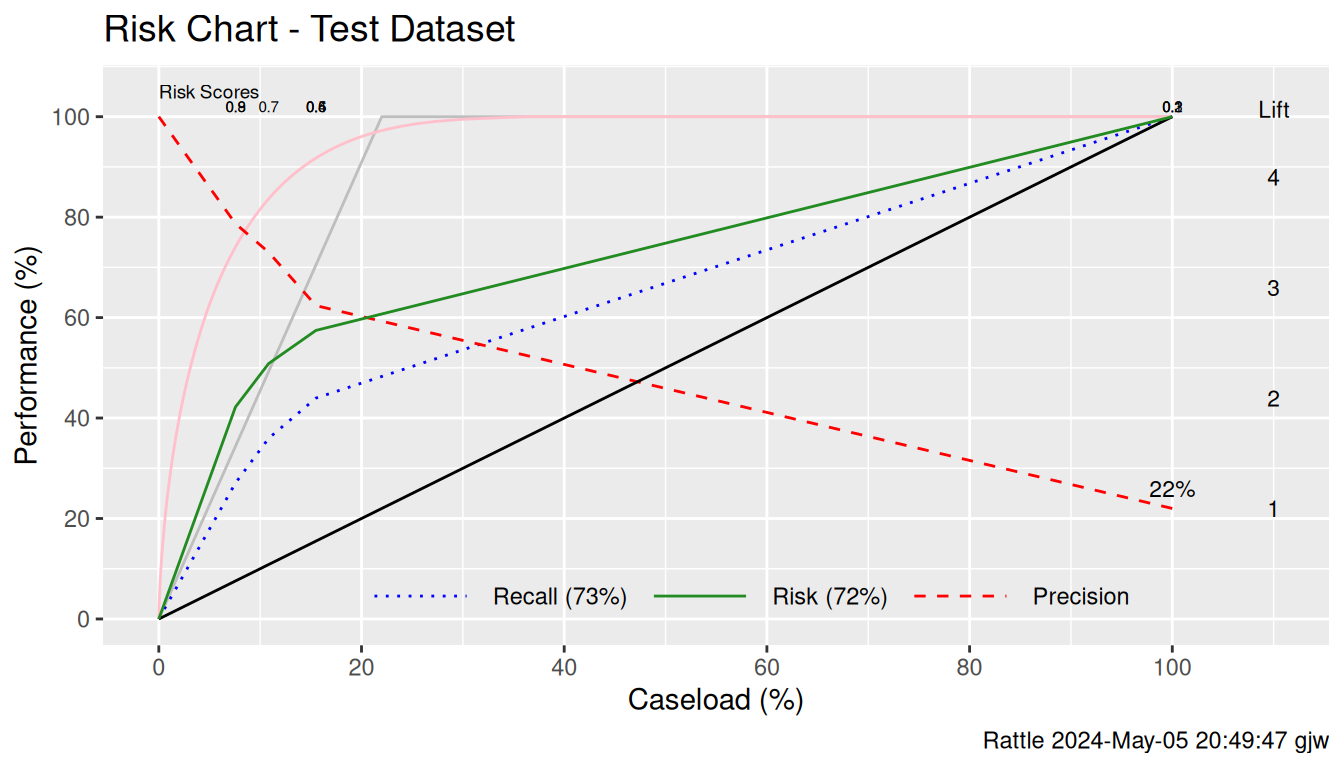
Your donation will support ongoing availability and give you access to the PDF version of this book. Desktop Survival Guides include Data Science, GNU/Linux, and MLHub. Books available on Amazon include Data Mining with Rattle and Essentials of Data Science. Popular open source software includes rattle, wajig, and mlhub. Hosted by Togaware, a pioneer of free and open source software since 1984. Copyright © 1995-2022 Graham.Williams@togaware.com Creative Commons Attribution-ShareAlike 4.0
