20.66 Weka Decision Tree Performance
Here we plot the performance of the decision tree, showing a risk chart. The areas under the recall and risk curves are also reported.
## Warning in ggplot2::guide_legend(keywidth = 3, labels = 1:3, title = "Legend"): Arguments in `...` must be used.
## ✖ Problematic argument:
## • labels = 1:3
## ℹ Did you misspell an argument name?
## Arguments in `...` must be used.
## ✖ Problematic argument:
## • labels = 1:3
## ℹ Did you misspell an argument name?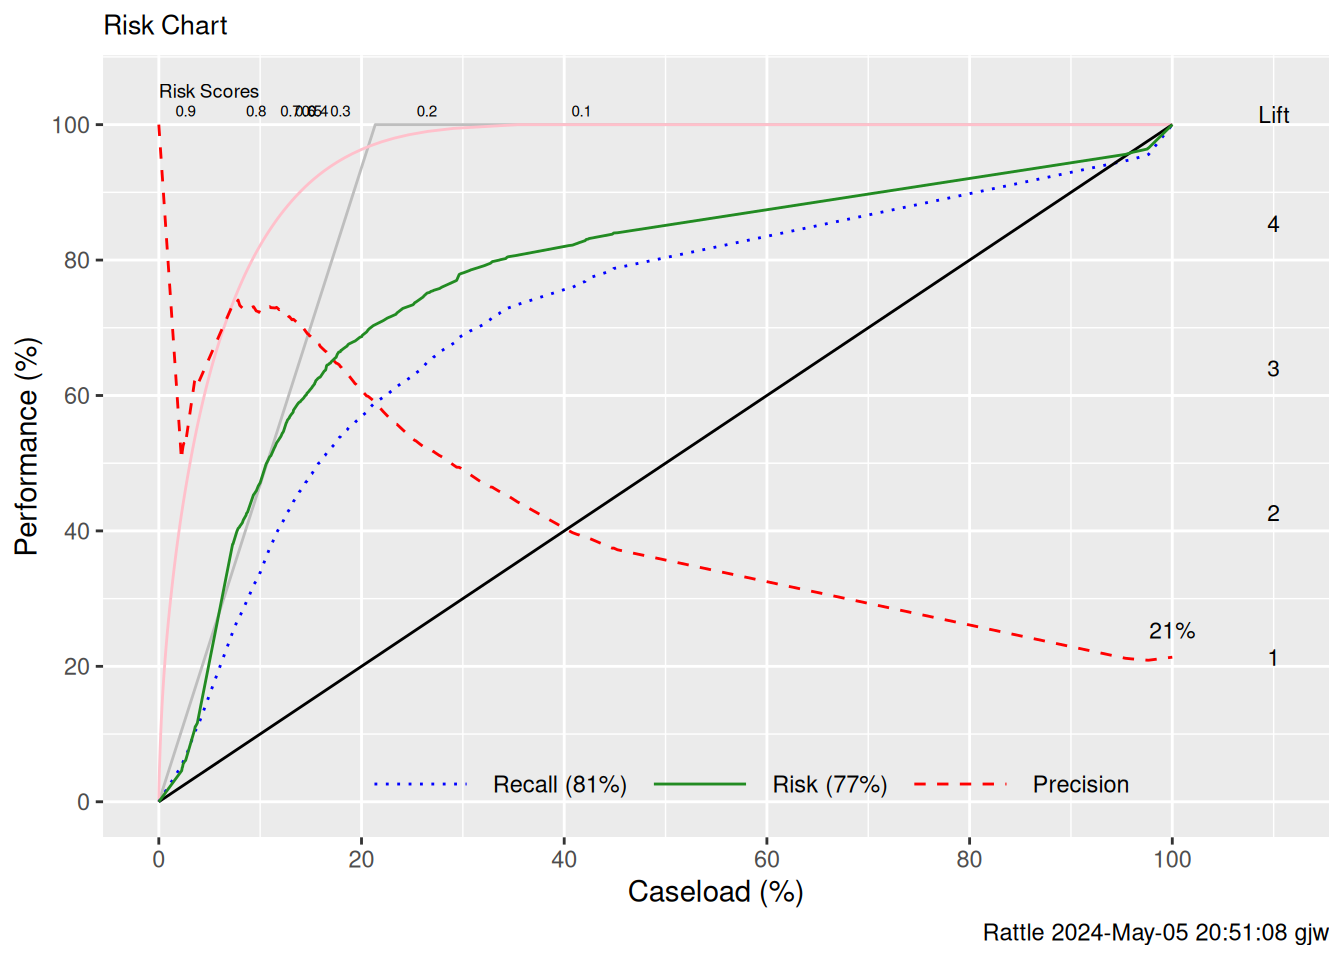
An error matrix shows, clockwise from the top left, the percentages of true negatives, false positives, true positives, and false negatives.
predicted <- predict(model, ds[te, vars], type="class")
sum(actual_te != predicted)/length(predicted) # Overall error rate
## [1] 0.1580176## Predicted
## Actual No Yes
## No 74 5
## Yes 11 10Your donation will support ongoing availability and give you access to the PDF version of this book. Desktop Survival Guides include Data Science, GNU/Linux, and MLHub. Books available on Amazon include Data Mining with Rattle and Essentials of Data Science. Popular open source software includes rattle, wajig, and mlhub. Hosted by Togaware, a pioneer of free and open source software since 1984. Copyright © 1995-2022 Graham.Williams@togaware.com Creative Commons Attribution-ShareAlike 4.0
