11.48 Line Chart Log X Axis
20200823
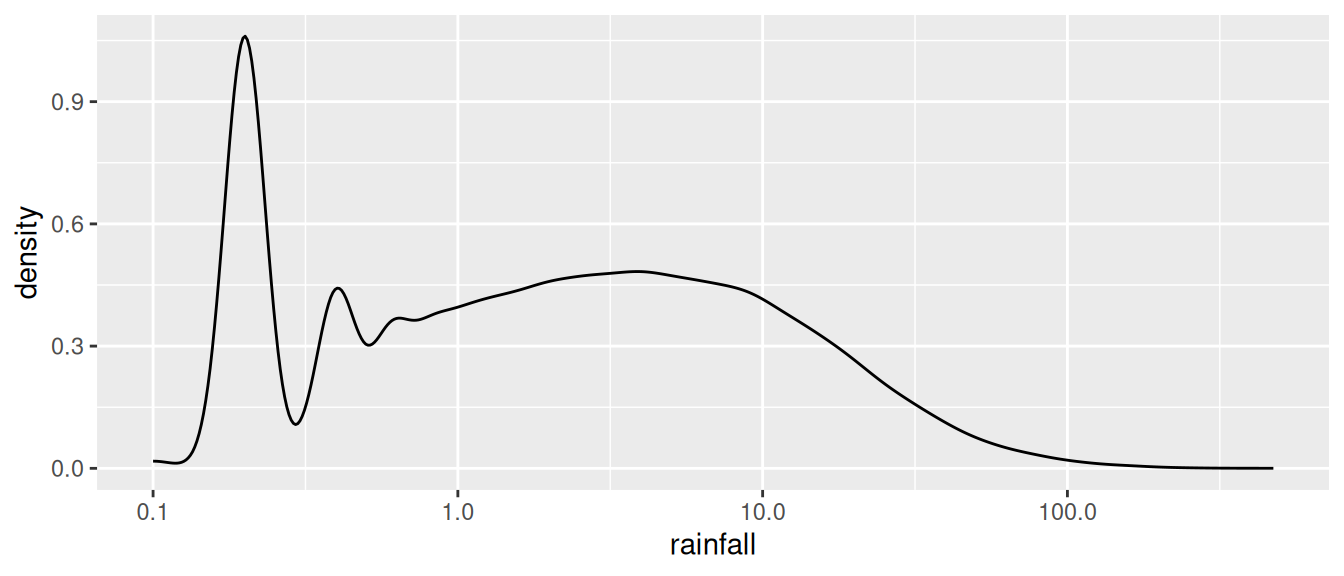
ds                                                                    %>%
  filter(rainfall != 0)                                               %>%
  ggplot(aes(x=rainfall))                                              +
  geom_density()                                                       +
  scale_x_log10()                                                      +
  theme(legend.position="none")
A common approach to dealing with the skewed distribution is to transform the scale to be a logarithmic scale, base 10. The following code produces Figure @ref(fig:ggplot2:frequency_rainfall_log_x).
Your donation will support ongoing availability and give you access to the PDF version of this book. Desktop Survival Guides include Data Science, GNU/Linux, and MLHub. Books available on Amazon include Data Mining with Rattle and Essentials of Data Science. Popular open source software includes rattle, wajig, and mlhub. Hosted by Togaware, a pioneer of free and open source software since 1984. Copyright © 1995-2022 Graham.Williams@togaware.com Creative Commons Attribution-ShareAlike 4.0
