20.33 RPart Plot Favourite
prp(model, type=2, extra=104, nn=TRUE, fallen.leaves=TRUE,
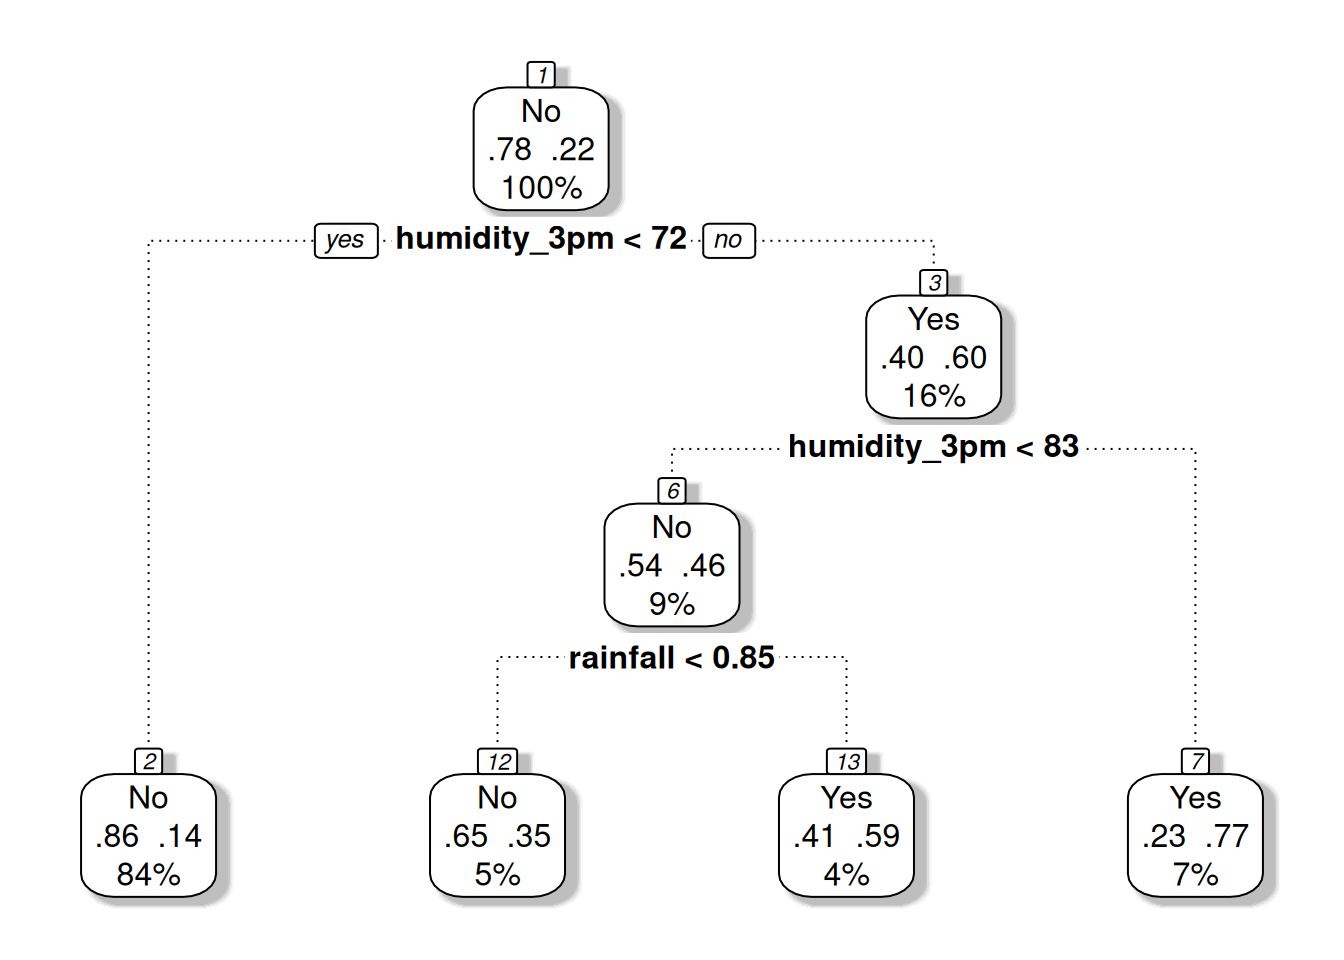
faclen=0, varlen=0, shadow.col="grey", branch.lty=3)This is a plot that I find particularly useful, neat, and informative, particularly for classification models.
The leaf nodes are each labelled with the predicted class. They are neatly lined up at the bottom of the figure (fallen.leaves=TRUE), to visually reinforce the structure. We can see the straight lines from the top to the bottom which lead to decisions quickly, whilst the more complex paths need quite a bit more information in order to make a decision.
Each node includes the probability for each class, and the percentage of observations associated with the node (extra=104). The node numbers are included (nn=TRUE) so we can cross reference each node to the text decision tree, or other decision tree plots, or a rule set generated from the decision tree.
Using a dotted line type (branch.lty=3) removes some of the focus from the heavy lines and back to the nodes, whilst still clearly identifying the links. The grey shadow is an optional nicety.
Your donation will support ongoing availability and give you access to the PDF version of this book. Desktop Survival Guides include Data Science, GNU/Linux, and MLHub. Books available on Amazon include Data Mining with Rattle and Essentials of Data Science. Popular open source software includes rattle, wajig, and mlhub. Hosted by Togaware, a pioneer of free and open source software since 1984. Copyright © 1995-2022 Graham.Williams@togaware.com Creative Commons Attribution-ShareAlike 4.0
