11.71 Violin Plot Embedded Box Plot
REVIEW
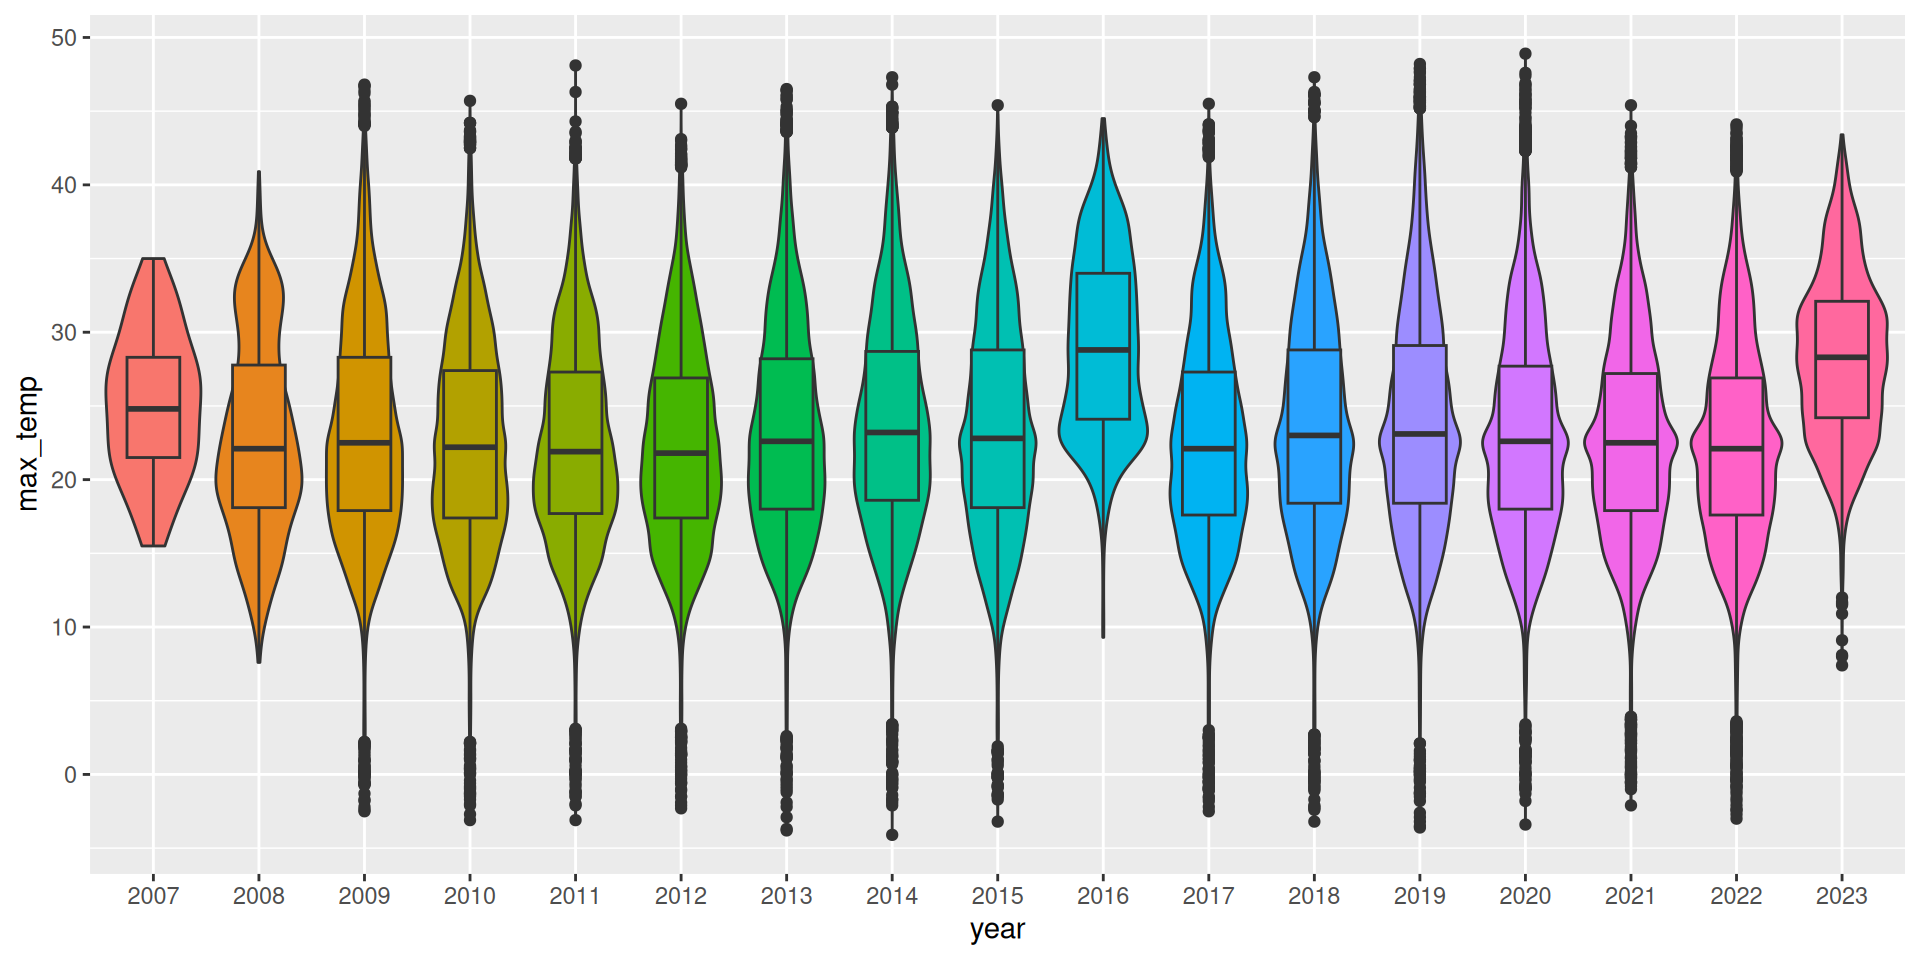
ds                                                                    %>%
  mutate(year=factor(format(ds$date, "%Y")))                          %>%
  ggplot(aes(x=year, y=max_temp, fill=year))                           +
  geom_violin()                                                        +
  geom_boxplot(width=.5, position=position_dodge(width=0))             +
  theme(legend.position="none")
We can overlay the violin plot with a box plot to show the quartiles.
Your donation will support ongoing availability and give you access to the PDF version of this book. Desktop Survival Guides include Data Science, GNU/Linux, and MLHub. Books available on Amazon include Data Mining with Rattle and Essentials of Data Science. Popular open source software includes rattle, wajig, and mlhub. Hosted by Togaware, a pioneer of free and open source software since 1984. Copyright © 1995-2022 Graham.Williams@togaware.com Creative Commons Attribution-ShareAlike 4.0
