11.67 Text Path Density Plot Text Location
20220109
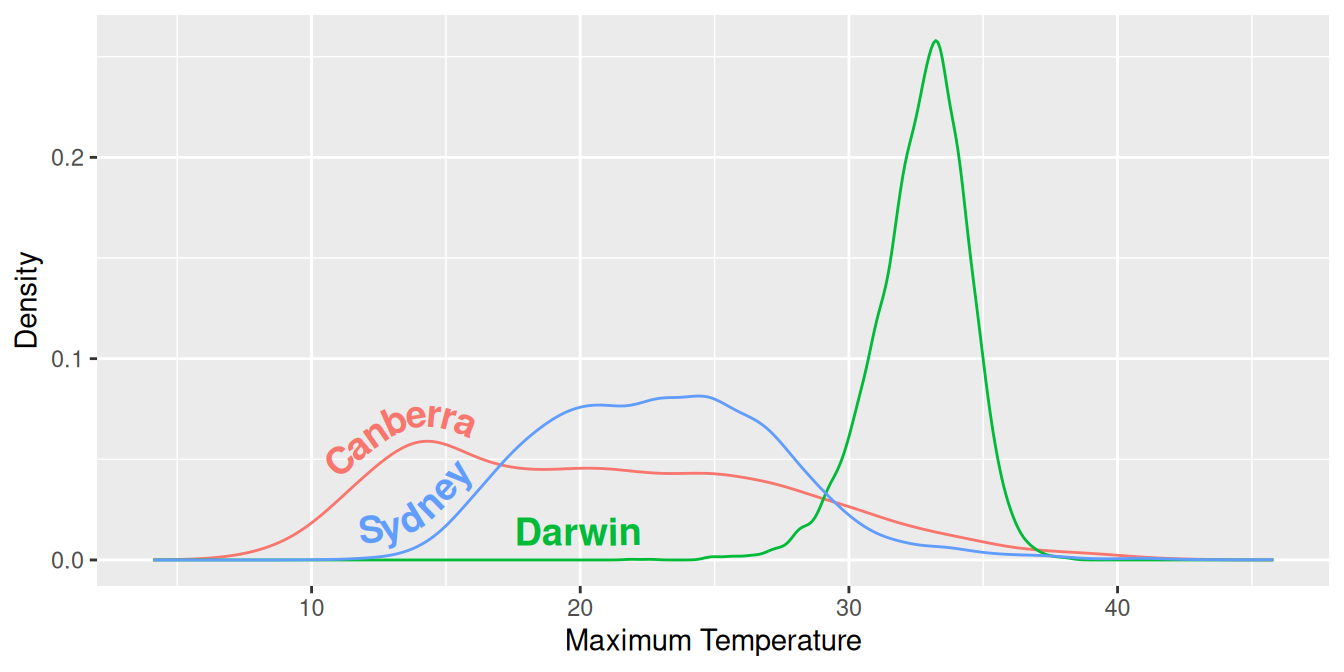
library(geomtextpath)
ds %>%
  filter(location %in% c("Canberra", "Sydney", "Darwin")) %>%
  ggplot(aes(x=max_temp, colour=location, label=location)) +
  geom_textdensity(size=5,
                   fontface=2,
                   vjust=-0.2,
                   hjust=0.2) +
  labs(x="Maximum Temperature", y="Density") +
  theme(legend.position="none")
Using geomtextpath (Cameron and van den Brand 2024) to flexibly add text to a plot, the
text can be moved to above or below the line with a change to the
vjust= option and how far along the plot the text appears is
controlled by hjust=.
References
Cameron, Allan, and Teun van den Brand. 2024. Geomtextpath: Curved Text in Ggplot2. https://allancameron.github.io/geomtextpath/.
Your donation will support ongoing availability and give you access to the PDF version of this book. Desktop Survival Guides include Data Science, GNU/Linux, and MLHub. Books available on Amazon include Data Mining with Rattle and Essentials of Data Science. Popular open source software includes rattle, wajig, and mlhub. Hosted by Togaware, a pioneer of free and open source software since 1984. Copyright © 1995-2022 Graham.Williams@togaware.com Creative Commons Attribution-ShareAlike 4.0
