11.66 Text Path Clock Multiple Plots
20220109
clock <- function(x)
{
hours <- c(rep(x[1] %% 12 + tail(x, 1) / 60, 2), 0, 3.5)
minutes <- c(rep(tail(x, 1)/5, 2), 0, 5)
as.data.frame(rbind(hours, minutes)) %>%
ggplot(aes(V1, V3)) +
geom_segment(aes(xend=V2, yend=V4),
size=c(2, 1),
lineend="round") +
geom_point(x=0, y=0, size=6) +
scale_x_continuous(limits=c(0, 12),
breaks=1:12,
label=as.roman) +
scale_y_continuous(limits=c(0, 6),
expand=c(0, 0)) +
theme_void() +
theme(plot.margin=unit(c(30,15,30,15), "pt"),
axis.text.x=element_text(size=10, face=2))
}
c1 <- clock(10:10) + coord_polar()
c2 <- clock(8:20) + coord_polar()
n <- now(); h <- lubridate::hour(n); m <- lubridate::minute(n)
c3 <- clock(h:m) + coord_polar()
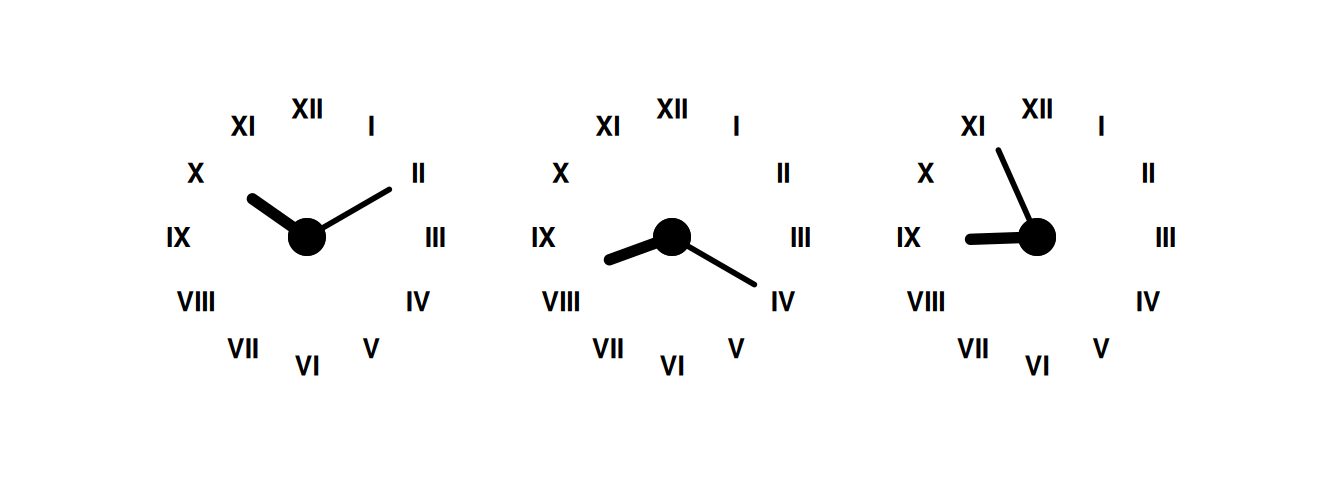
c1 + c2 + c3The clock is an example from geomtextpath (Cameron and van den Brand 2024) and
demonstrates a nice hack to produce a clock face. Any time can be
specified in the call to clock().
In our example we have three clocks generated and using
patchwork (Pedersen 2024) the multiple plots are displayed as a single
plot through the + operator.
References
Cameron, Allan, and Teun van den Brand. 2024. Geomtextpath: Curved Text in Ggplot2. https://allancameron.github.io/geomtextpath/.
Pedersen, Thomas Lin. 2024. Patchwork: The Composer of Plots. https://patchwork.data-imaginist.com.
Your donation will support ongoing availability and give you access to the PDF version of this book. Desktop Survival Guides include Data Science, GNU/Linux, and MLHub. Books available on Amazon include Data Mining with Rattle and Essentials of Data Science. Popular open source software includes rattle, wajig, and mlhub. Hosted by Togaware, a pioneer of free and open source software since 1984. Copyright © 1995-2022 Graham.Williams@togaware.com Creative Commons Attribution-ShareAlike 4.0
