3.18 Pipes and Plots
REVIEW A common scenario for pipeline processing is to prepare data for plotting. Indeed, plotting itself has a pipeline type concept where we build a plot by adding layers to it.
Below the rattle::weatherAUS dataset is
dplyr::filter()ed for observations from four Australian
cities. We dplyr::filter() observations that have missing
values for the variable Temp3pm using an embedded
pipeline. The embedded pipeline pipes the Temp3pm data
through the base::is.na() function which tests if the value
is missing. These results are then piped to magrittr::not()
which inverts the true/false values so that we include those that are
not missing.
A plot is generated using ggplot2::ggplot() into which we pipe the processed dataset. We add a geometric layer using ggplot2::geom_density() which consists of a density plot with transparency specified through the argument. We also add a title and label the axes using ggplot2::labs().
cities <- c("Canberra", "Darwin", "Melbourne", "Sydney")

ds %>%
  filter(location %in% cities) %>%
  filter(temp_3pm %>% is.na() %>% not()) %>%
  ggplot(aes(x=temp_3pm, colour=location, fill=location)) +
  geom_density(alpha=0.55) +
  labs(title = "Density Distributions of the 3pm Temperature",
       x     = "Temperature Recorded at 3pm",
       y     = "Density")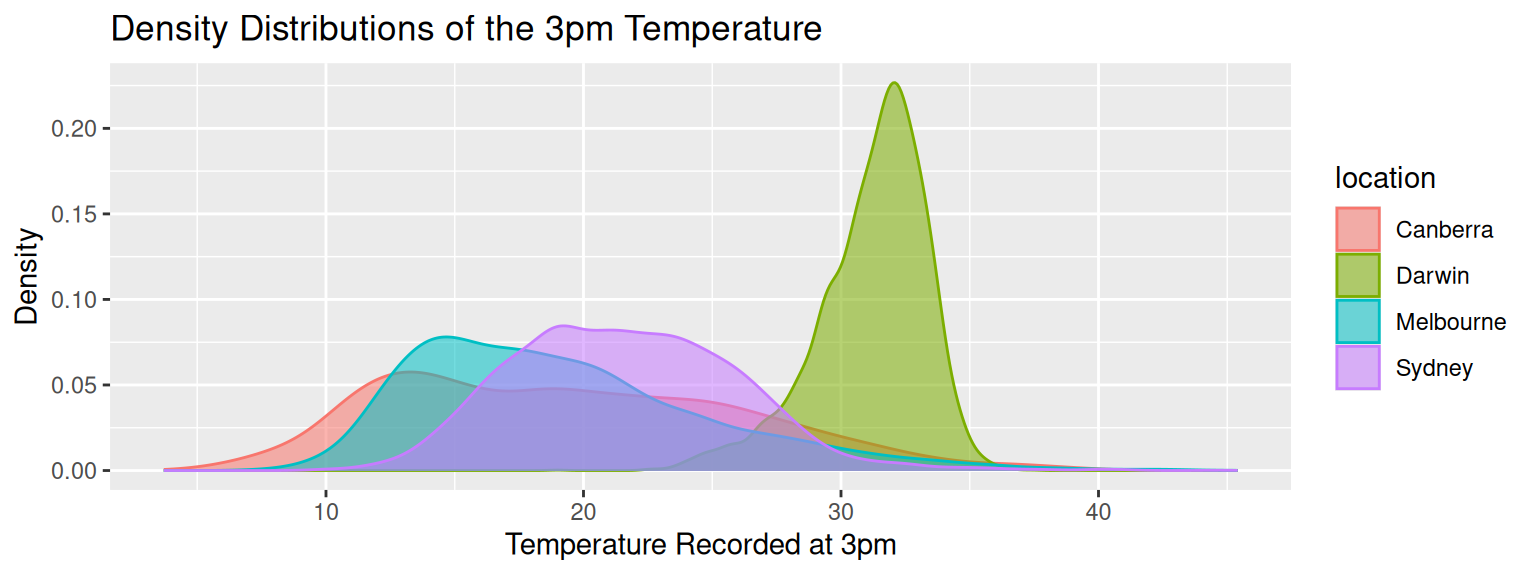
We now observe and tell a story from the plot. Our narrative will begin with the observation that Darwin has quite a different and warmer pattern of temperatures at 3pm than Canberra, Melbourne and Sydney. Canberra is on the colder side with Sydney generally warmer than Melbourne!
If you find this curated material useful then you can consider a donation to support it's ongoing availability and give you access to the PDF version of this book. The material has been scoped up by Generative AI without permission or any kind of recompense so do consider a donation if you can afford it. Unlike Generative AI your access to this materials is freely given. Desktop Survival Guides include Data Science, GNU/Linux, and MLHub. Books available on Amazon include Data Mining with Rattle and Essentials of Data Science. Togaware has a 30 year tradition of making popular open source software which includes sold privacy preserving productivity apps, rattle, wajig, and mlhub. Hosted by Togaware, a pioneer of free and open source software since 1984. Copyright © 1995-2022 Graham.Williams@togaware.com Creative Commons Attribution-ShareAlike 4.0