11.47 Line Chart Skewed Distributions
20200823
ds %>%
filter(rainfall != 0) %>%
ggplot(aes(x=rainfall)) +
geom_density() +
scale_y_continuous(labels=comma) +
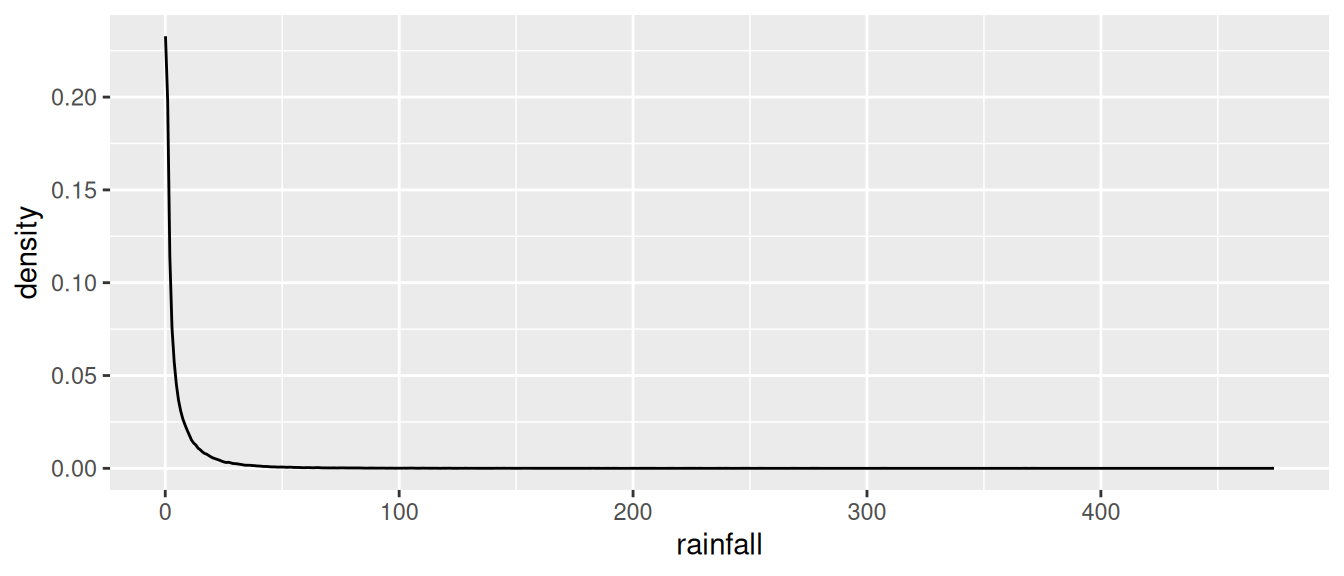
theme(legend.position="none")The plot informs us about the skewed nature of the amount of rainfall recorded for any one day, but we lose a lot of resolution at the low end.
Note that we use a subset of the dataset to include only those observations of rainfall (i.e., where the rainfall is non-zero). Otherwise a warning will note many rows contain non-finite values in calculating the density statistic.
Your donation will support ongoing availability and give you access to the PDF version of this book. Desktop Survival Guides include Data Science, GNU/Linux, and MLHub. Books available on Amazon include Data Mining with Rattle and Essentials of Data Science. Popular open source software includes rattle, wajig, and mlhub. Hosted by Togaware, a pioneer of free and open source software since 1984. Copyright © 1995-2022 Graham.Williams@togaware.com Creative Commons Attribution-ShareAlike 4.0
