20.34 Enhanced Plot: With Colour
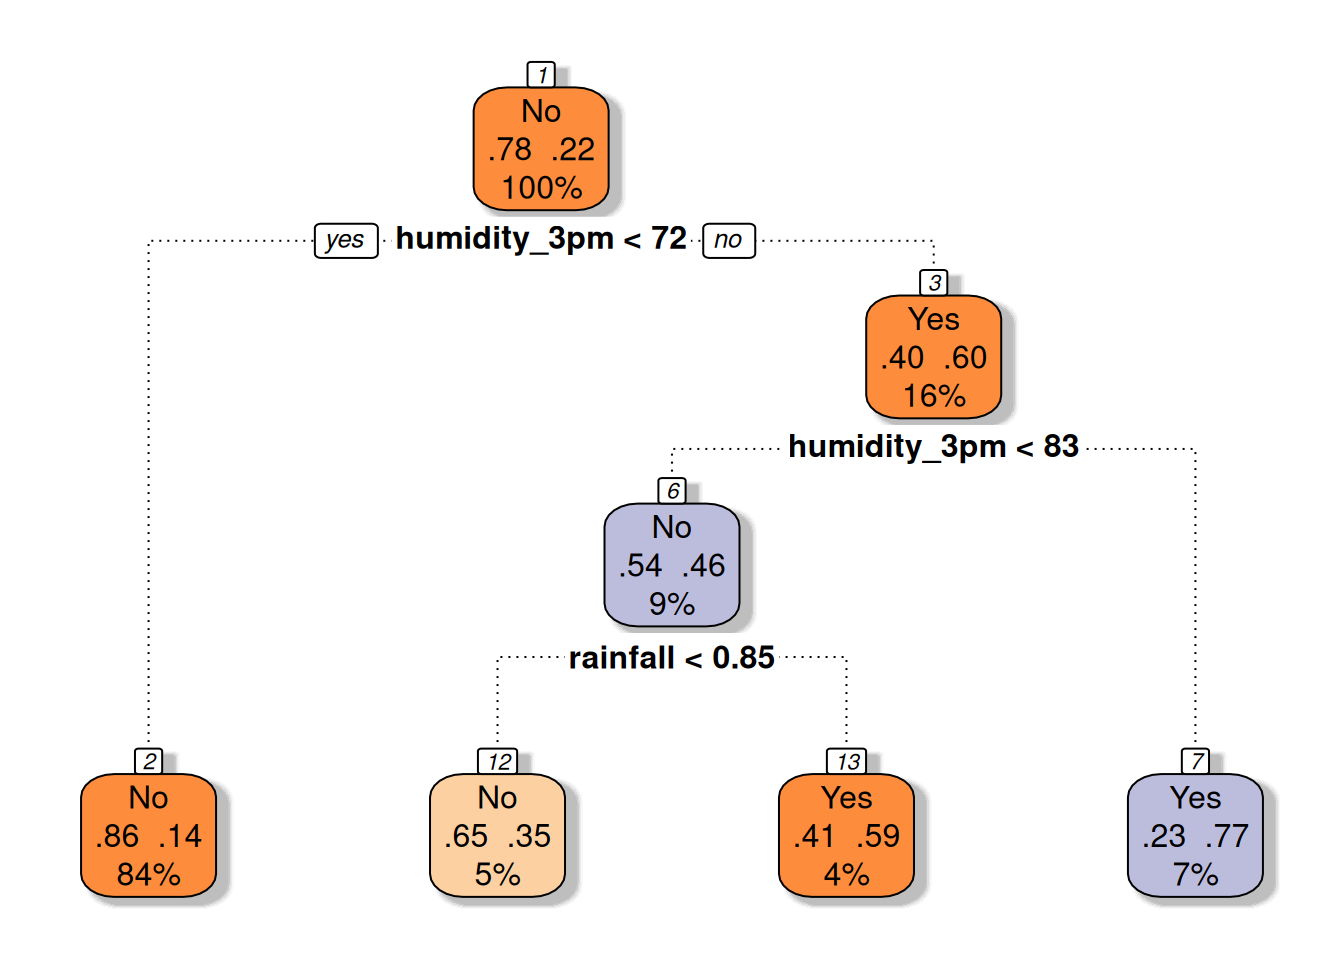
col <- c("#FD8D3C", "#FD8D3C", "#FD8D3C", "#BCBDDC",
         "#FDD0A2", "#FD8D3C", "#BCBDDC")
prp(model, type=2, extra=104, nn=TRUE, fallen.leaves=TRUE,
    faclen=0, varlen=0, shadow.col="grey", branch.lty=3, box.col=col)
The rattle::fancyRpartPlot() function from (G. Williams 2022) generates scaled colour for colouring the boxes depending on the decision and the strength. The hard work is in generating the scaled colours for the nodes. Here we use other palettes for the colours rather than those used by rattle::fancyRpartPlot().
References
Williams, Graham. 2022. Rattle: Graphical User Interface for Data Science in r. https://rattle.togaware.com/.
Your donation will support ongoing availability and give you access to the PDF version of this book. Desktop Survival Guides include Data Science, GNU/Linux, and MLHub. Books available on Amazon include Data Mining with Rattle and Essentials of Data Science. Popular open source software includes rattle, wajig, and mlhub. Hosted by Togaware, a pioneer of free and open source software since 1984. Copyright © 1995-2022 Graham.Williams@togaware.com Creative Commons Attribution-ShareAlike 4.0
