21.36 Letter and Position Heatmap
## Warning in geom_text(aes(fill = value, label = values2), size = text.size, :
## Ignoring unknown aesthetics: fill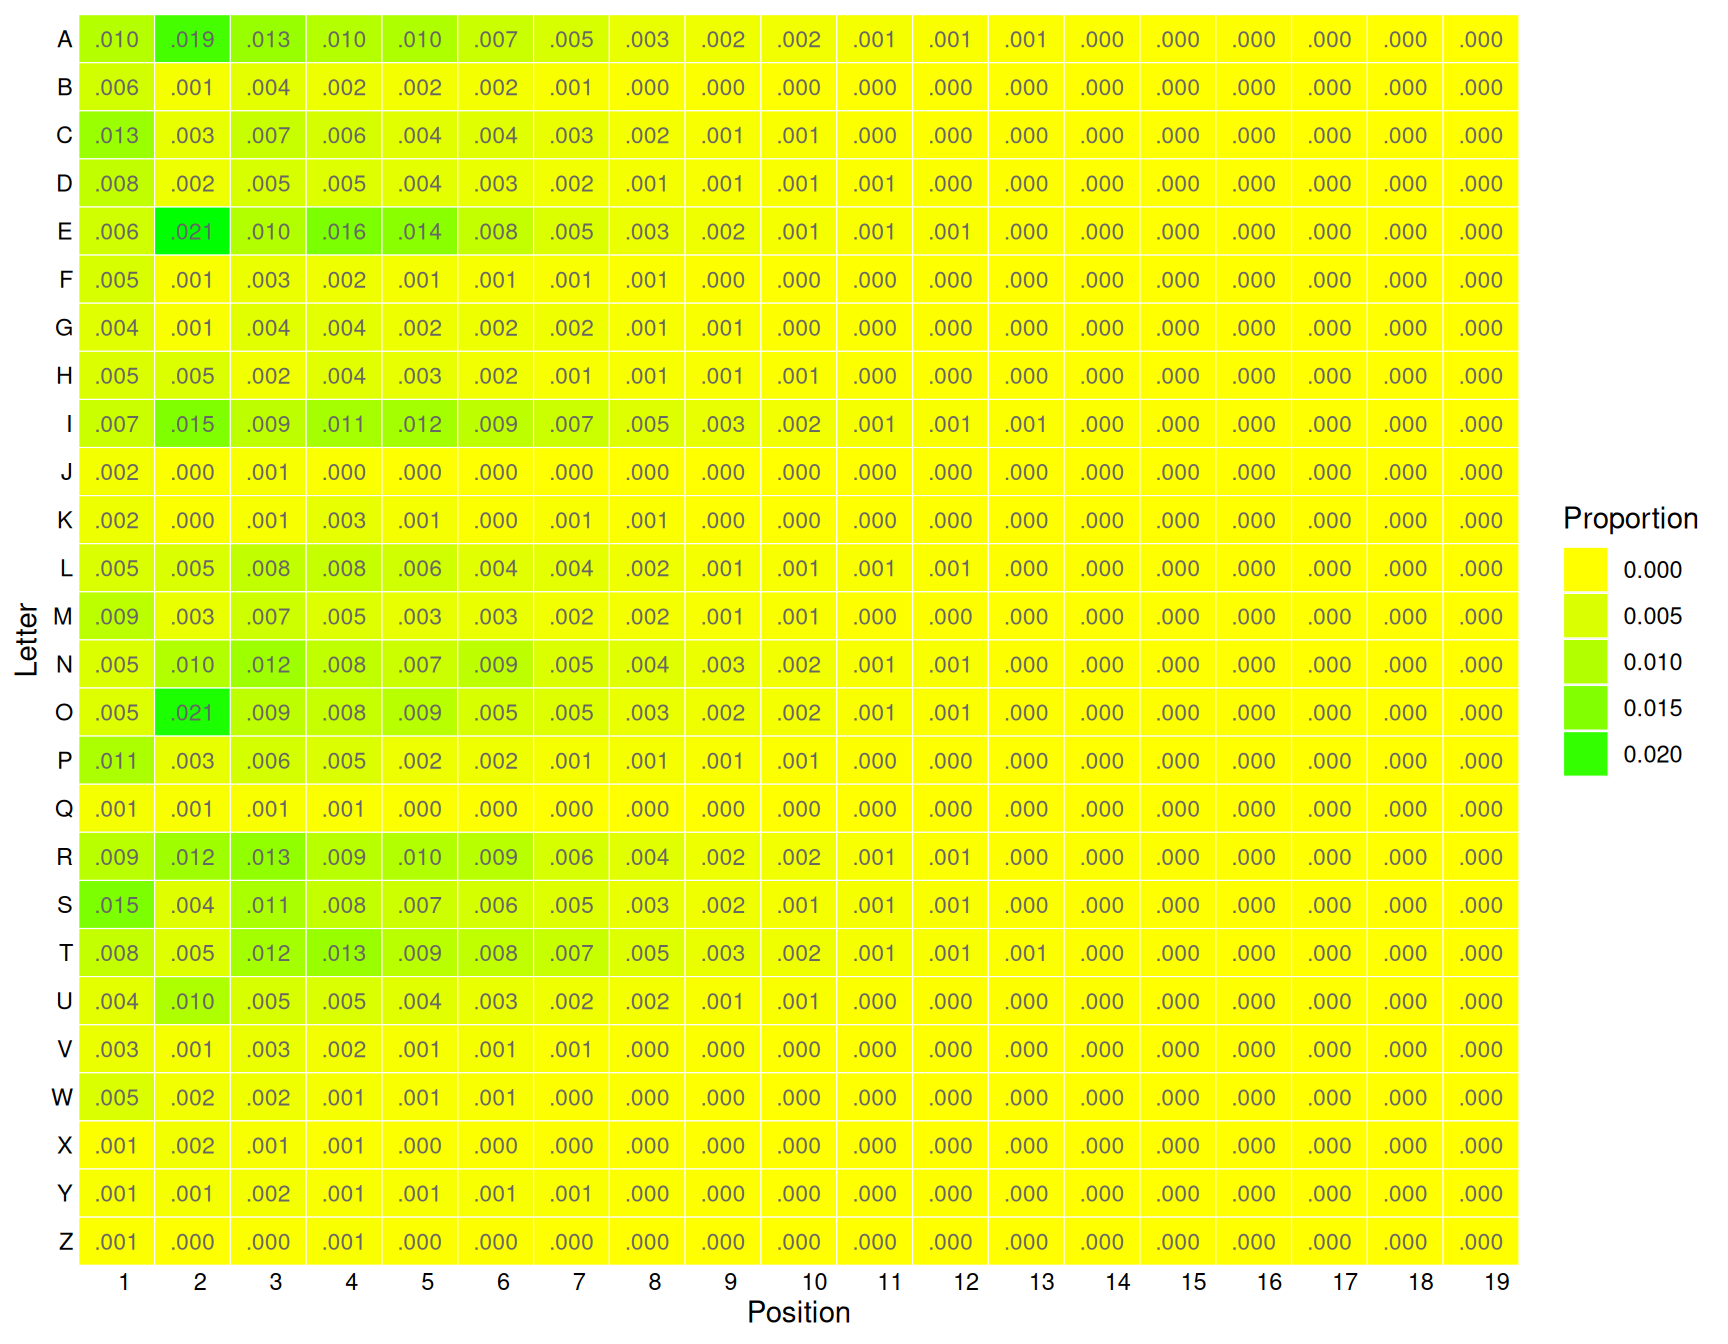
The qdap::qheat() function from qdap (Rinker 2023) provides an effective visualisation of tabular data. Here we transform the list of words into a position count of each letter, and constructing a table of the proportions that is passed on to qdap::qheat() to do the plotting.
words                                                                 %>%
  lapply(function(x) sapply(letters, gregexpr, x, fixed=TRUE))        %>%
  unlist                                                              %>%
  (function(x) x[x!=-1])                                              %>%
  (function(x) setNames(x, gsub("\\d", "", names(x))))                %>%
  (function(x) apply(table(data.frame(letter=toupper(names(x)),
                                      position=unname(x))),
                     1, function(y) y/length(x)))                     %>%
  qheat(high="green", low="yellow", by.column=NULL,
        values=TRUE, digits=3, plot=FALSE)                             +
  labs(y="Letter", x="Position") +
  theme(axis.text.x=element_text(angle=0))                             +
  guides(fill=guide_legend(title="Proportion"))
References
———. 2023. Qdap: Bridging the Gap Between Qualitative Data and Quantitative Analysis. https://trinker.github.io/qdap/.
Your donation will support ongoing availability and give you access to the PDF version of this book. Desktop Survival Guides include Data Science, GNU/Linux, and MLHub. Books available on Amazon include Data Mining with Rattle and Essentials of Data Science. Popular open source software includes rattle, wajig, and mlhub. Hosted by Togaware, a pioneer of free and open source software since 1984. Copyright © 1995-2022 Graham.Williams@togaware.com Creative Commons Attribution-ShareAlike 4.0
