11.26 Box Plot in Rattle
20240728
ds %>%
dplyr::mutate(rain_tomorrow=as.factor(rain_tomorrow)) %>%
ggplot2::ggplot(ggplot2::aes(y=min_temp)) +
ggplot2::geom_boxplot(ggplot2::aes(x="All"), notch=TRUE, fill="grey") +
ggplot2::stat_summary(ggplot2::aes(x="All"), fun=mean, geom="point", shape=8) +
ggplot2::geom_boxplot(ggplot2::aes(x=rain_tomorrow, fill=rain_tomorrow), notch=TRUE) +
ggplot2::stat_summary(ggplot2::aes(x=rain_tomorrow), fun=mean, geom="point", shape=8) +
ggplot2::xlab(paste("rain_tomorrow\n\n", "RattleNG 2024-07-28 06:25:32 gjw", sep="")) +
ggplot2::ggtitle("Distribution of min_temp by rain_tomorrow") +
ggplot2::theme(legend.position="none") +
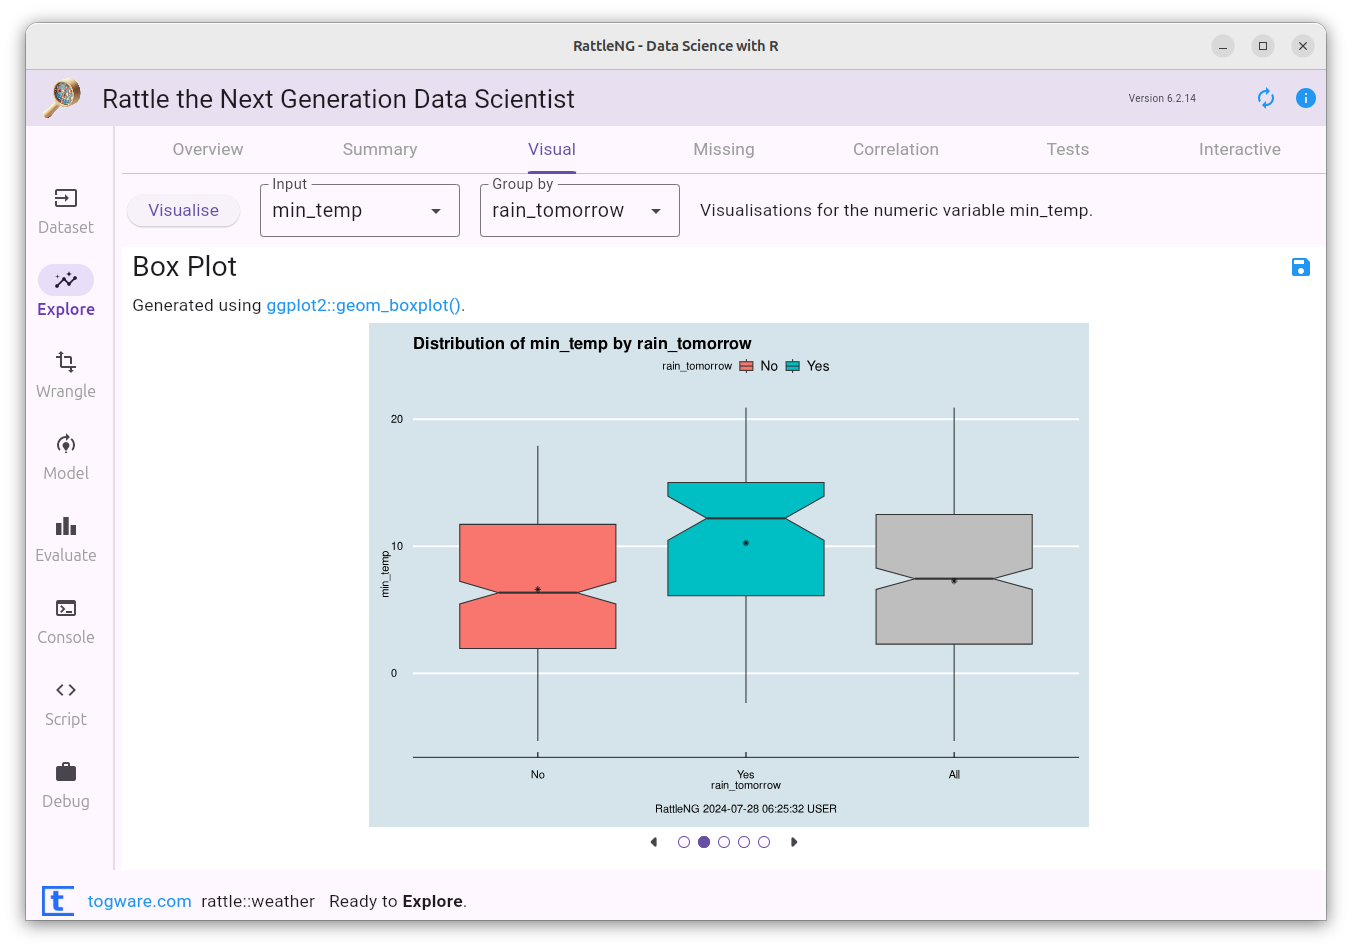
theme_rattle()In Rattle, if we have identified a Target (or a Group By) variable,
then the box plot will show the distribution of the values of the
variable partitioned by the values of the target/group variable. For
the weather dataset we can, for example, plot the variable min_temp
grouped by rain_tomorrow.
Your donation will support ongoing availability and give you access to the PDF version of this book. Desktop Survival Guides include Data Science, GNU/Linux, and MLHub. Books available on Amazon include Data Mining with Rattle and Essentials of Data Science. Popular open source software includes rattle, wajig, and mlhub. Hosted by Togaware, a pioneer of free and open source software since 1984. Copyright © 1995-2022 Graham.Williams@togaware.com Creative Commons Attribution-ShareAlike 4.0
