2.22 RStudio Review
REVIEW
Figure @ref(fig:intror:rstudio_weather_scatterplot) shows the
RStudio editor as it appears after we have typed the above commands
into the R Script file in the top left pane. We have sent
the commands to the R Console to have it run by R. We
have done this by ensuring the cursor within the R Script
editor is on the same line as the command to be run and then clicking
the Run button. We will notice that the command is sent to
the R Console in the bottom left pane and the cursor
advances to the next line within the R Script editor.
After each command is run any text output by the command is displayed
in the R Console whilst graphic output is displayed in the
Plots tab of the bottom right pane.
This is now our first program in R. We can now provide our first observations of the data. It is not too hard to see from the plot that there appears to be quite a strong relationship between the minimum temperature and the maximum temperature: with higher values of the minimum temperature recorded on any particular day we see higher values of the maximum temperature. There is also a clear lower boundary that might suggest, as logic would dictate, that the maximum temperature can not be less than the minimum temperature. If we were to observe data points below this line then we would begin to explore issues with the quality of the data.
As data scientists we have begun our observation and understanding of the data, taking our first steps toward immersing ourselves in and thereby beginning to understand the data.
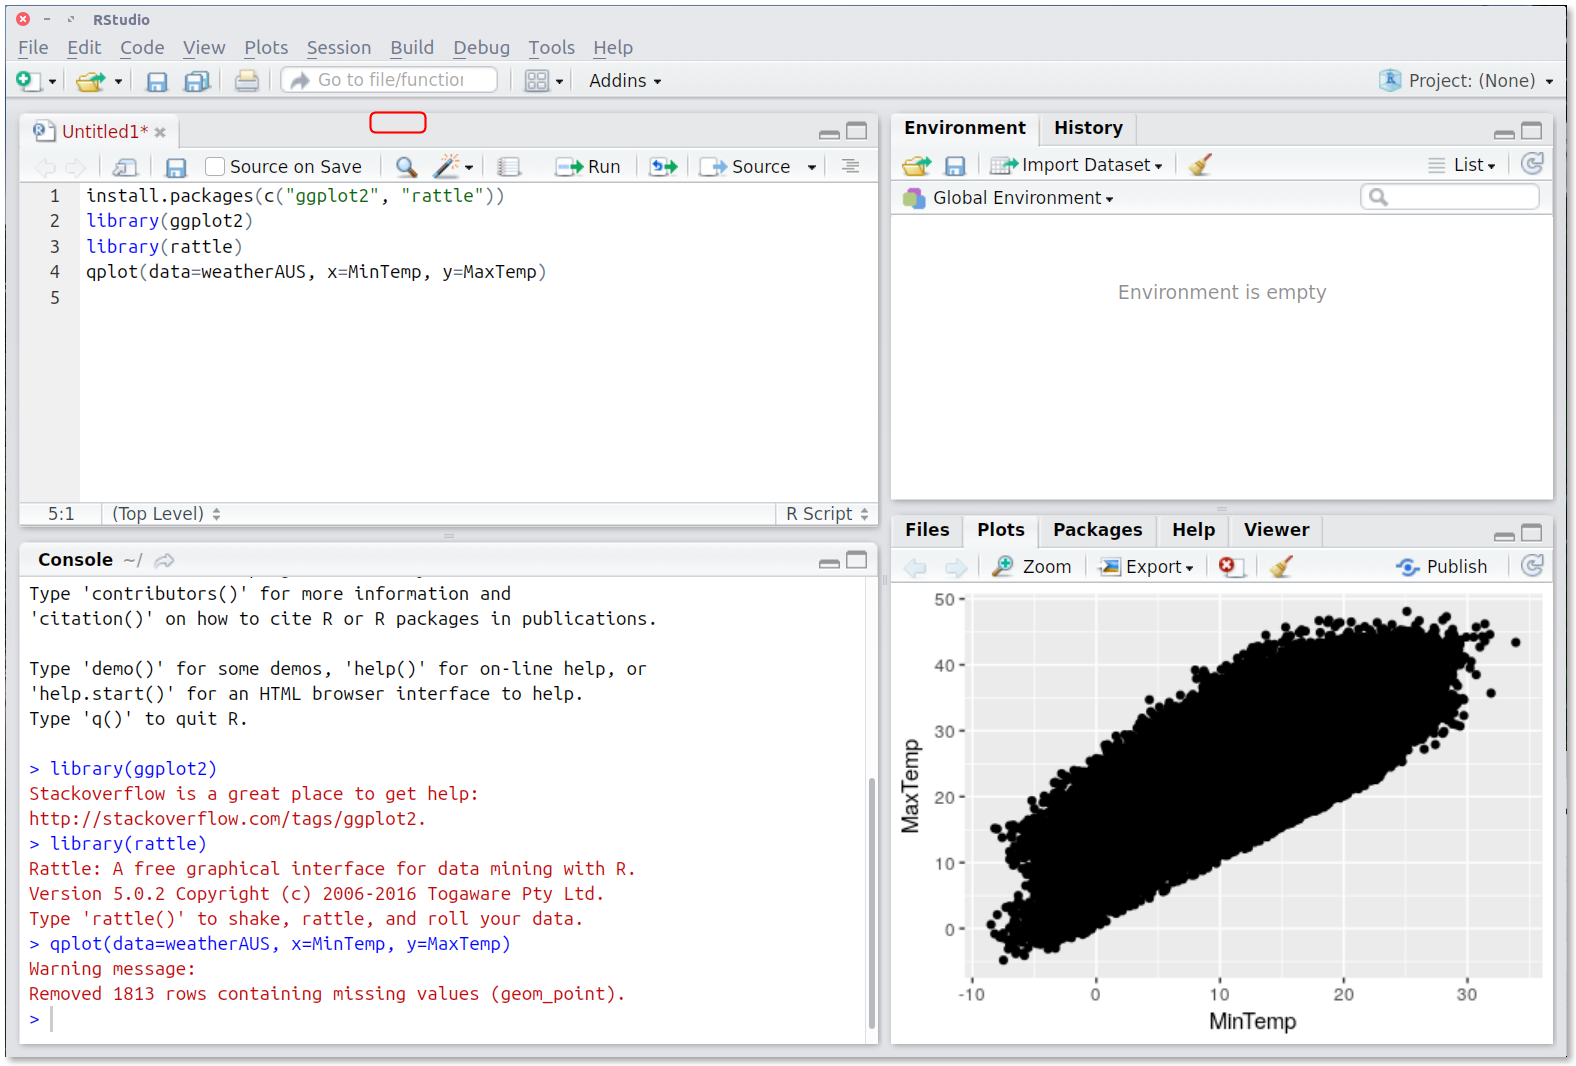
Running R commands in RStudio. The R programming code is written into
a file using the editor in the top left pane. With the cursor on the
line containing the code we click the Run button to pass the code on
to the R Console to have it run by the R Interpreter to produce the
plot we see in the bottom right pane.
{#fig:intror:rstudio_weather_scatterplot}
If you find this curated material useful then you can consider a donation to support it's ongoing availability and give you access to the PDF version of this book. The material has been scoped up by Generative AI without permission or any kind of recompense so do consider a donation if you can afford it. Unlike Generative AI your access to this materials is freely given. Desktop Survival Guides include Data Science, GNU/Linux, and MLHub. Books available on Amazon include Data Mining with Rattle and Essentials of Data Science. Togaware has a 30 year tradition of making popular open source software which includes sold privacy preserving productivity apps, rattle, wajig, and mlhub. Hosted by Togaware, a pioneer of free and open source software since 1984. Copyright © 1995-2022 Graham.Williams@togaware.com Creative Commons Attribution-ShareAlike 4.0