11.15 Bar Chart Narrow Bars
20200428
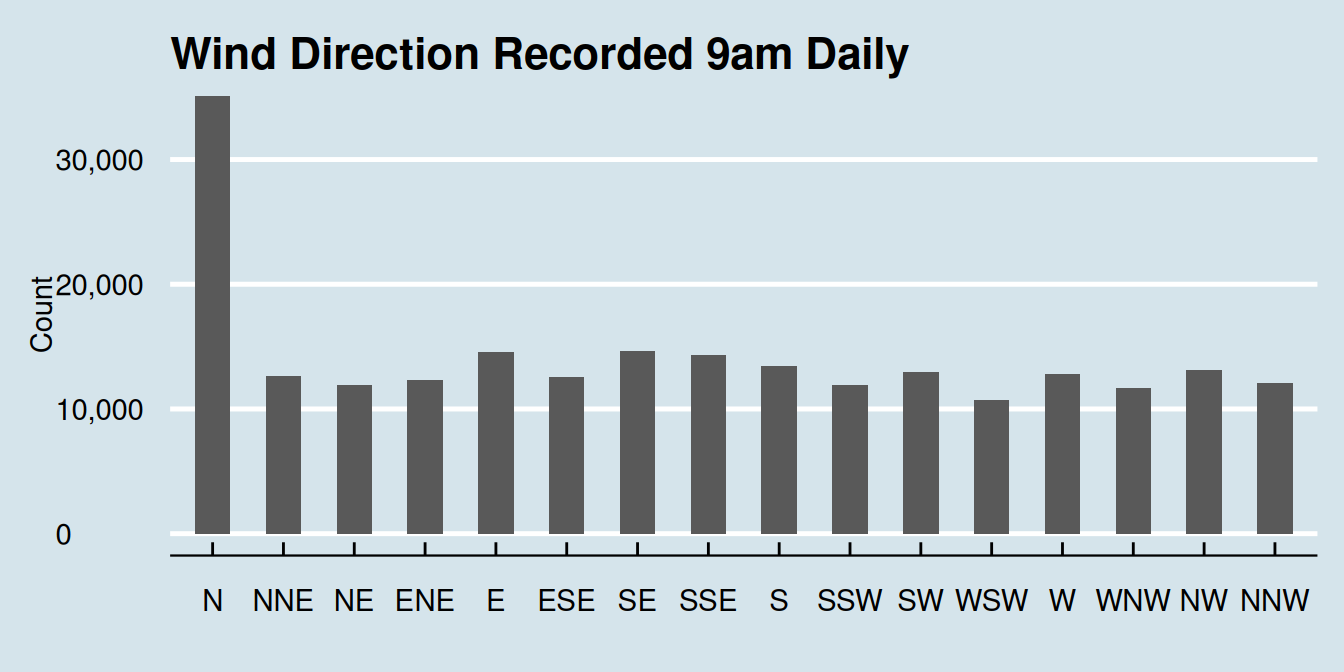
ds %>%
  ggplot(aes(wind_dir_9am)) +
  geom_bar(width=0.5) +
  scale_y_continuous(labels=comma) +
  labs(x="", title="Wind Direction as Recorded at 9am Daily", y="Count") +
  ggthemes::theme_economist()
The width of the bars can be specified, relative to the space allowed
for each bar. Here we make the bars narrower using
width=0.5 so as to be half width. This may help to
make the plot look less dark.
Notice the use of the ggthemes::theme_economist() for a bit of variety. To suit this theme the usual x label is moved to be the title.
Your donation will support ongoing development and give you access to the PDF version of the book. Desktop Survival Guides include Data Science, GNU/Linux, and MLHub. Books available on Amazon include Data Mining with Rattle and Essentials of Data Science. Popular open source software includes rattle, wajig, and mlhub. Hosted by Togaware, a pioneer of free and open source software since 1984.
Copyright © 1995-2021 Graham.Williams@togaware.com Creative Commons Attribution-ShareAlike 4.0.